Touchwork and Envision Strategies: Partnership in Technology and Consulting Services
We are pleased to announce a partnership with Envision Strategies, marking a significant milestone for Touchwork in our ongoing commitment to providing top-tier solutions that enable organizations to monitor, measure, and ultimately enhance their customer experience.
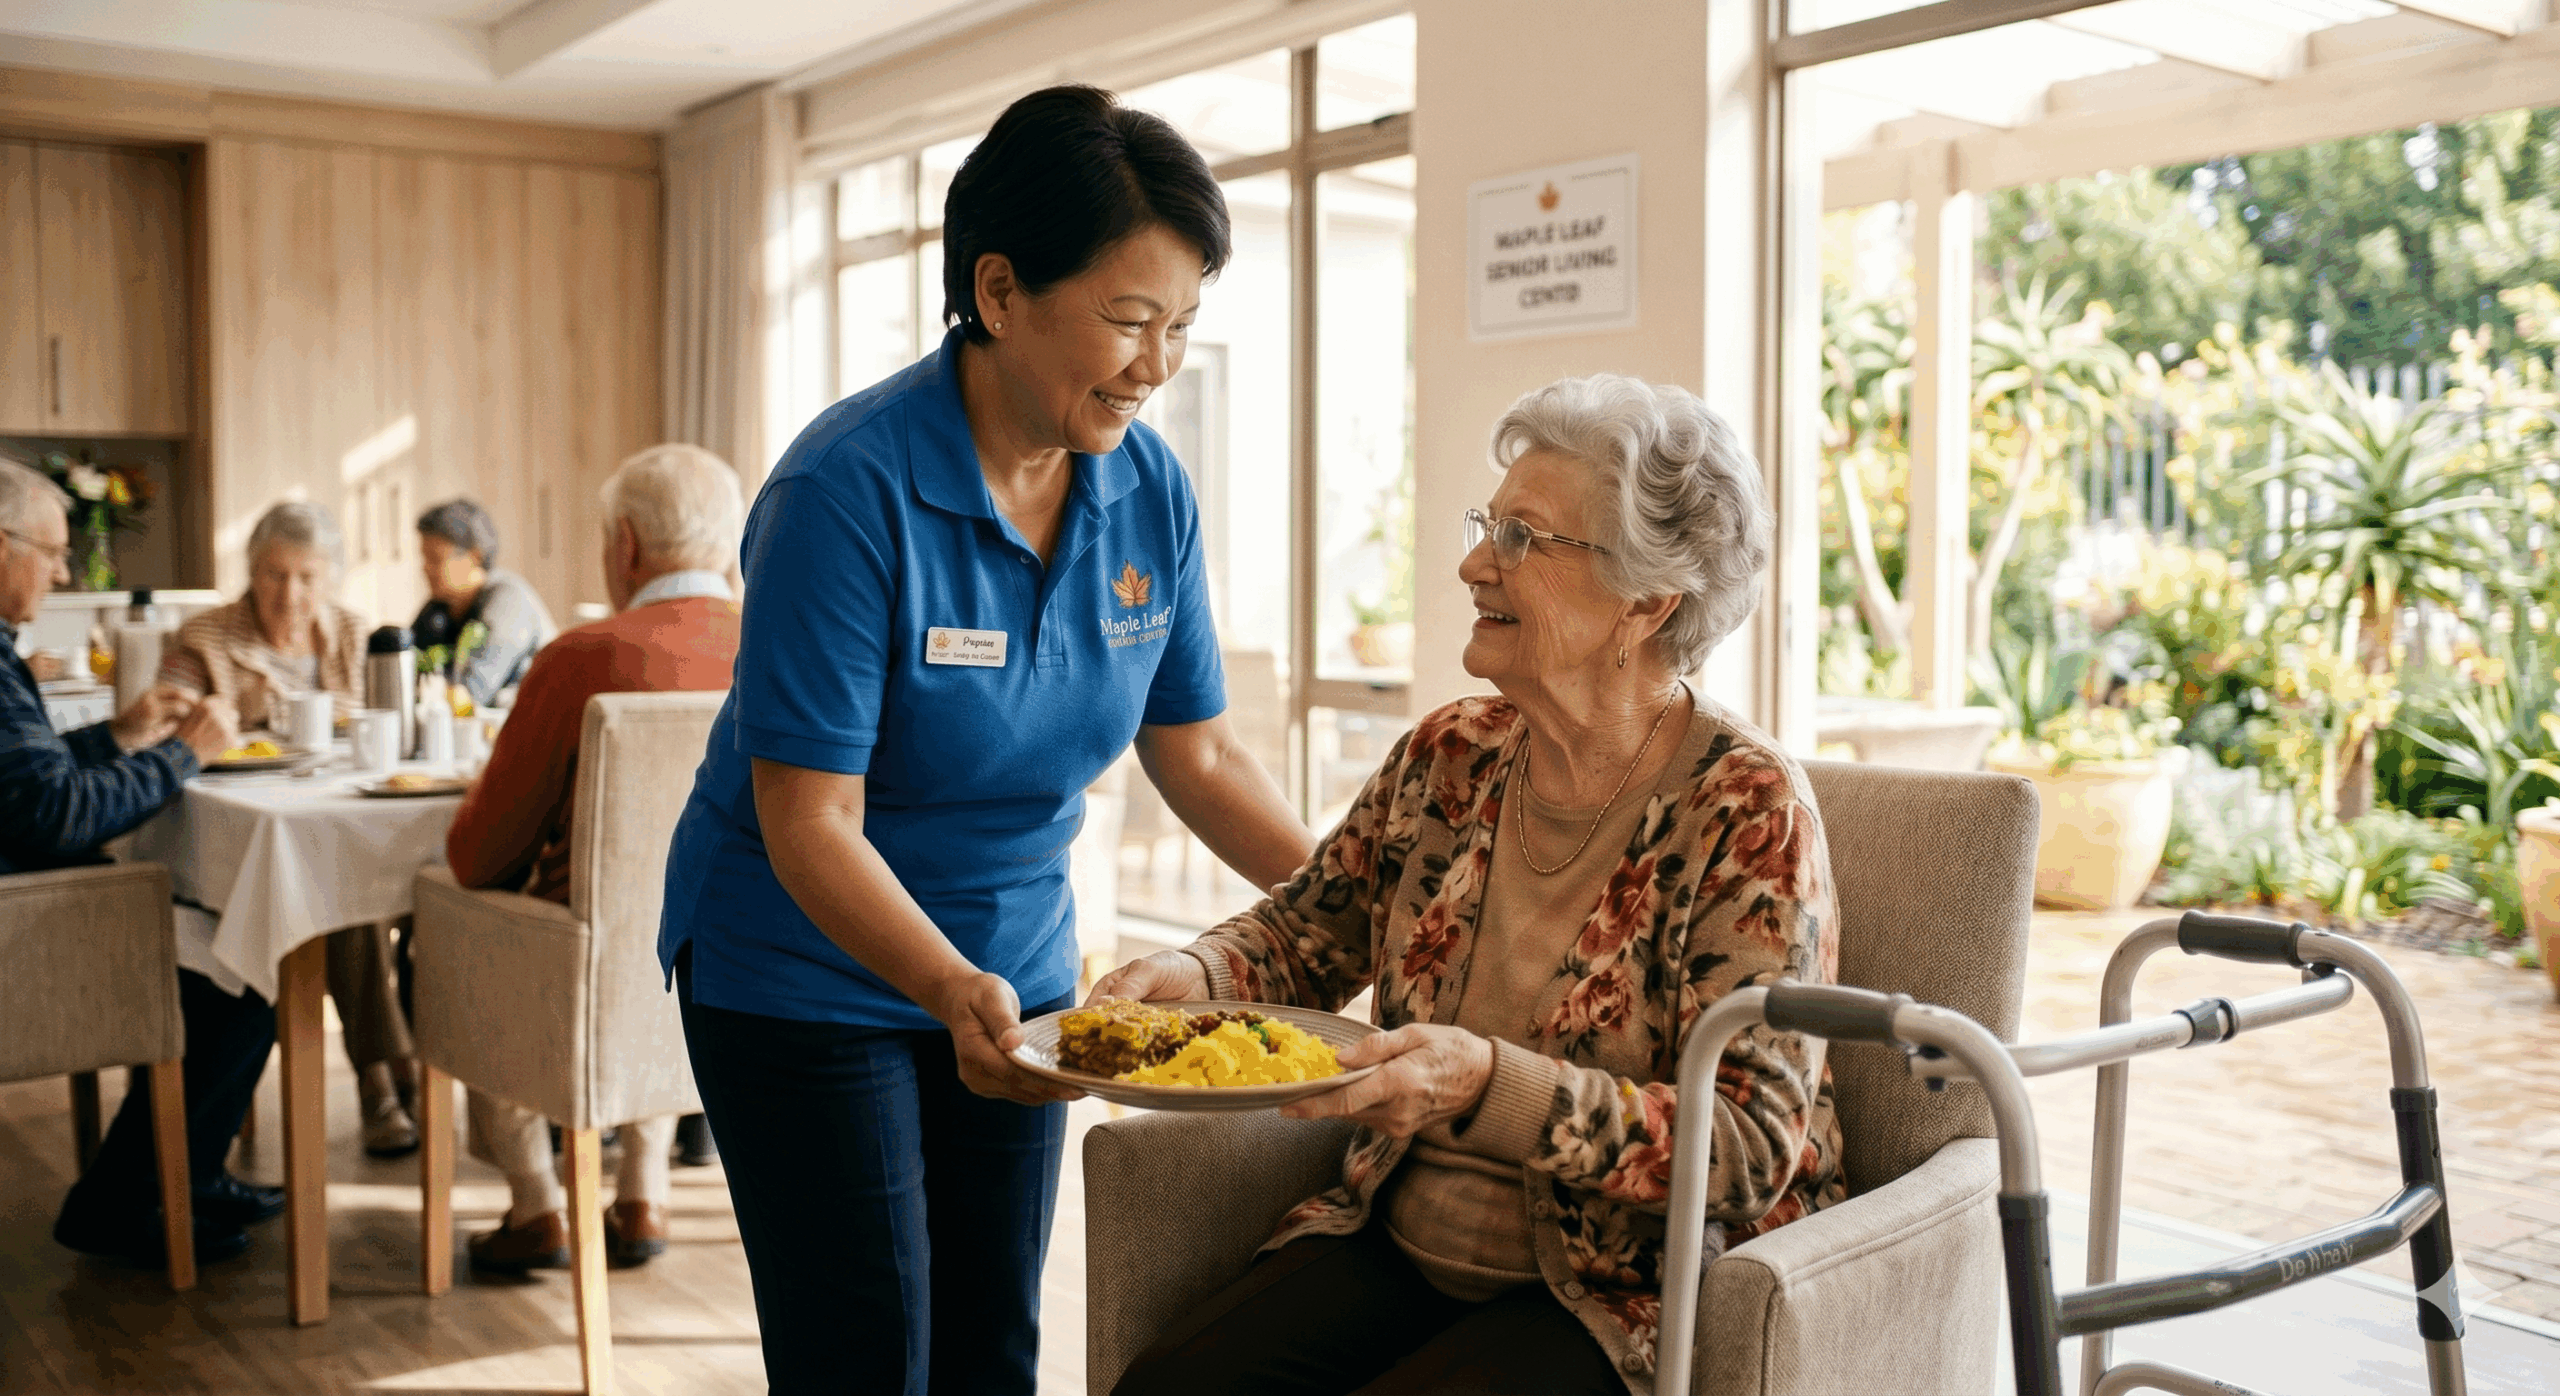
Envision Strategies is a consultancy dedicated to assisting foodservice and hospitality organizations in innovating, optimizing services, and improving performance. The recent launch of their enhanced Envision360 Ver1.5 Dining Performance solution powered by Touchwork underscores their dedication to enabling organizations to boost operational performance and excellence in dining programs.
At Touchwork, we pride ourselves on our position at the forefront of technological innovation in customer experience (CX) solutions. We are thrilled to partner with Envision in supporting the development of the Envision360 Ver1.5 solution.

What does this partnership mean for our clients?
By combining our cutting-edge technology with Envision Strategies’ consulting services, we are poised to deliver unparalleled value to our clients.
First and foremost, in addition to the Envision360 solution, our clients continue to have access to our extensive suite of real time feedback and audit solutions to monitor and measure their CX, and internal operations in order to comply with industry standards.
With Envision Strategies as a consulting partner, our clients can gain access to a wealth of additional expertise and resources. Any supplementary consulting services required, beyond the scope of our existing solutions, can be facilitated through Envision Strategies’ team of expert consultants.
This partnership amplifies our ability to provide comprehensive, end-to-end solutions tailored to the unique needs of each client. Whether it’s leveraging data analytics to uncover actionable insights or implementing strategic initiatives for service enhancement, together, Touchwork and Envision Strategies are fully equipped to drive tangible results.
As we embark on this collaborative journey, we remain steadfast in our commitment to empowering organizations to exceed customer expectations and thrive in today’s competitive landscape. The synergy between Touchwork and Envision Strategies represents a powerful fusion of technology and industry expertise, poised to redefine the standards of excellence in CX management for dining services.
We are excited about the possibilities that lie ahead and look forward to embarking on this transformative journey with our valued clients.